The Test Runner
What you'll learn
- The names and purposes of the visual parts of the Cypress Test Runner
- How to use the Selector Playground for targeting your page elements
Overview
Cypress runs tests in a unique interactive runner that allows you to see commands as they execute while also viewing the application under test.
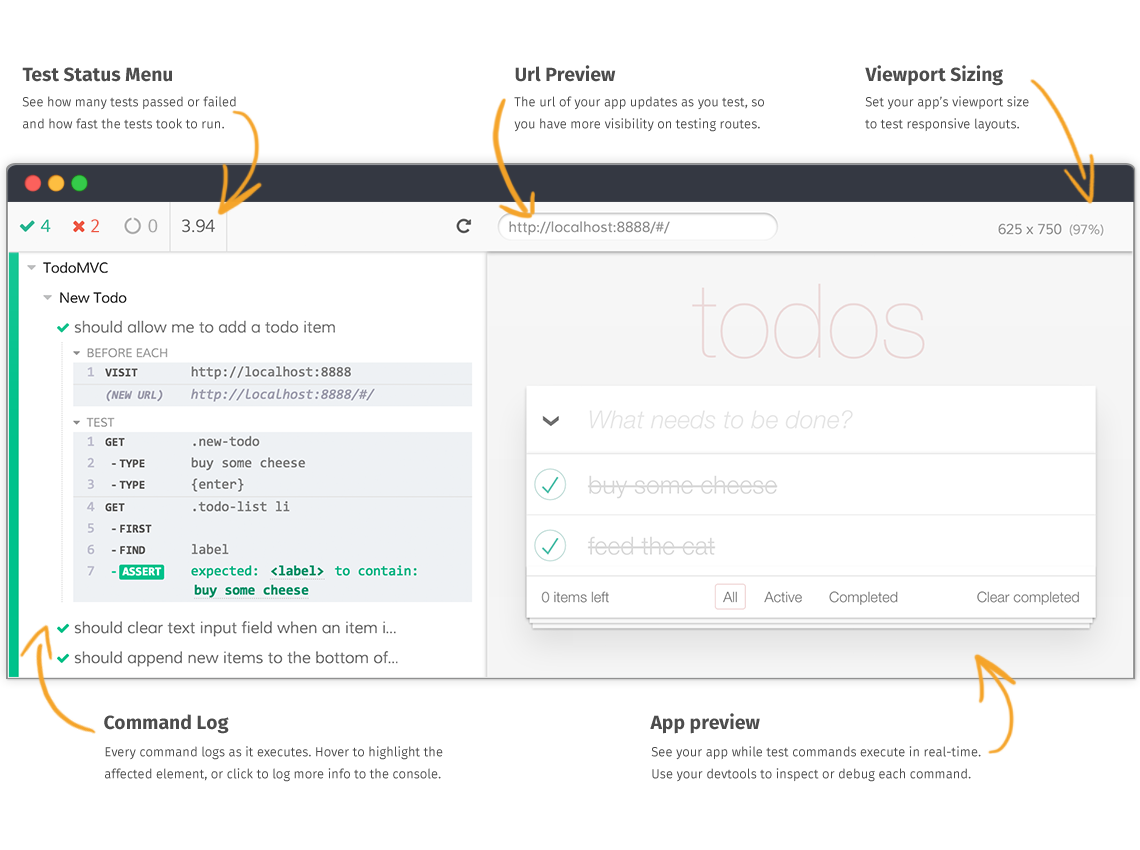
Command Log
The lefthand side of the Test Runner is a visual representation of your test
suite. Each test block is properly nested and each test, when clicked, displays
every Cypress command and assertion executed within the test's block as well as
any command or assertion executed in relevant before, beforeEach,
afterEach, and after hooks.
Open files in your IDE
There are some places in the Command Log that display a link to the relevant file where the code is located. Clicking on this link will open the file in your preferred file opener.
Hovering on Commands
Each command and assertion, when hovered over, restores the Application Under Test (righthand side) to the state it was in when that command executed. This allows you to 'time-travel' back to previous states of your application when testing.
By default, Cypress keeps 50 tests worth of snapshots and command data for time
traveling. If you are seeing extremely high memory consumption in your browser,
you may want to lower the numTestsKeptInMemory in your
configuration.
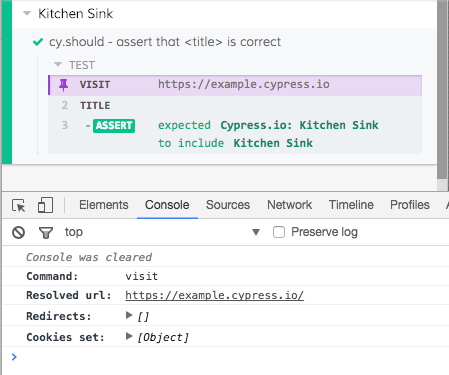
Clicking on Commands
Each command, assertion, or error, when clicked on, displays extra information in the dev tools console. Clicking also 'pins' the Application Under Test (righthand side) to its previous state when the command executed.
Errors
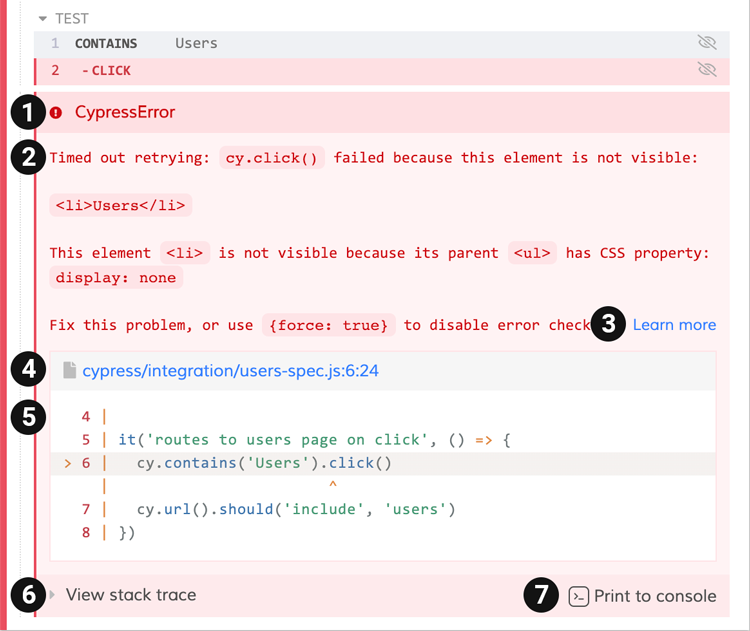
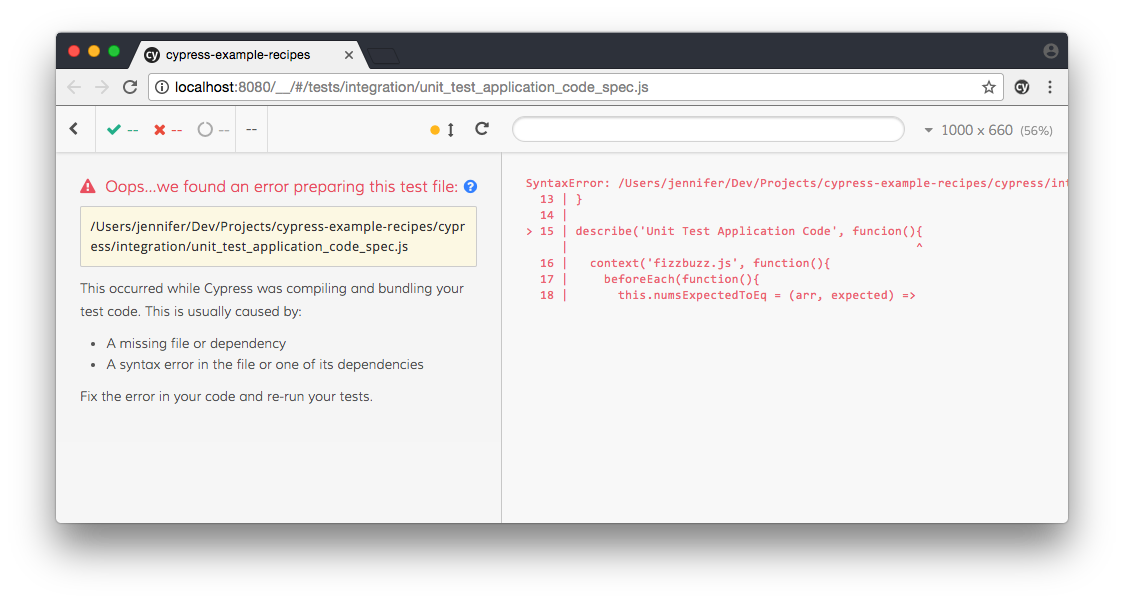
Cypress prints several pieces of information when an error occurs during a Cypress test.
- Error name: This is the type of the error (e.g. AssertionError, CypressError)
- Error message: This generally tells you what went wrong. It can vary in length. Some are short like in the example, while some are long, and may tell you exactly how to fix the error.
- Learn more: Some error messages contain a Learn more link that will take you to relevant Cypress documentation.
- Code frame file: This is usually the top line of the stack trace and it shows the file, line number, and column number that is highlighted in the code frame below. Clicking on this link will open the file in your preferred file opener and highlight the line and column in editors that support it.
- Code frame: This shows a snippet of code where the failure occurred, with the relevant line and column highlighted.
- View stack trace: Clicking this toggles the visibility of the stack trace. Stack traces vary in length. Clicking on a blue file path will open the file in your preferred file opener.
- Print to console button: Click this to print the full error to your DevTools console. This will usually allow you to click on lines in the stack trace and open files in your DevTools.
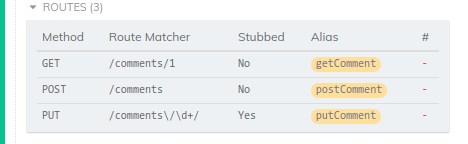
Instrument Panel
For certain commands like cy.intercept(),
cy.stub(), and cy.spy(), an extra
instrument panel is displayed above the test to give more information about the
state of your tests.
Routes
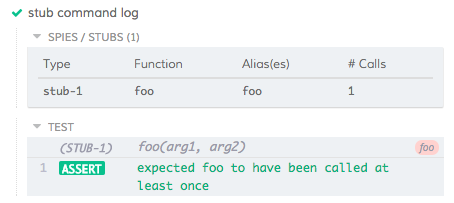
Stubs
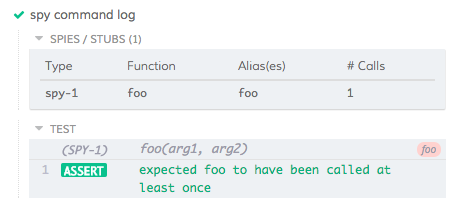
Spies
Application Under Test
The righthand side of the Test Runner is used to display the Application Under
Test (AUT): the application that was navigated to using a
cy.visit() or any subsequent routing calls made from
the visited application.
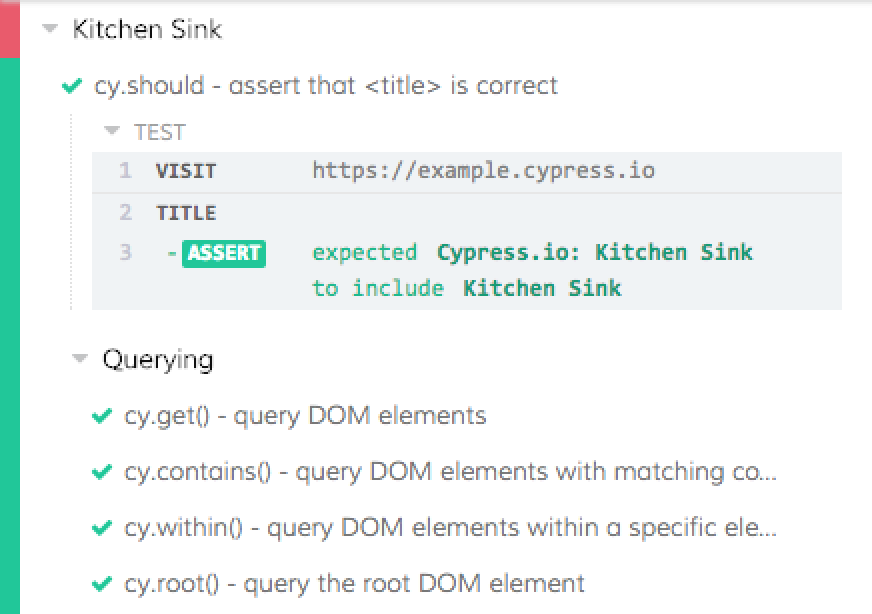
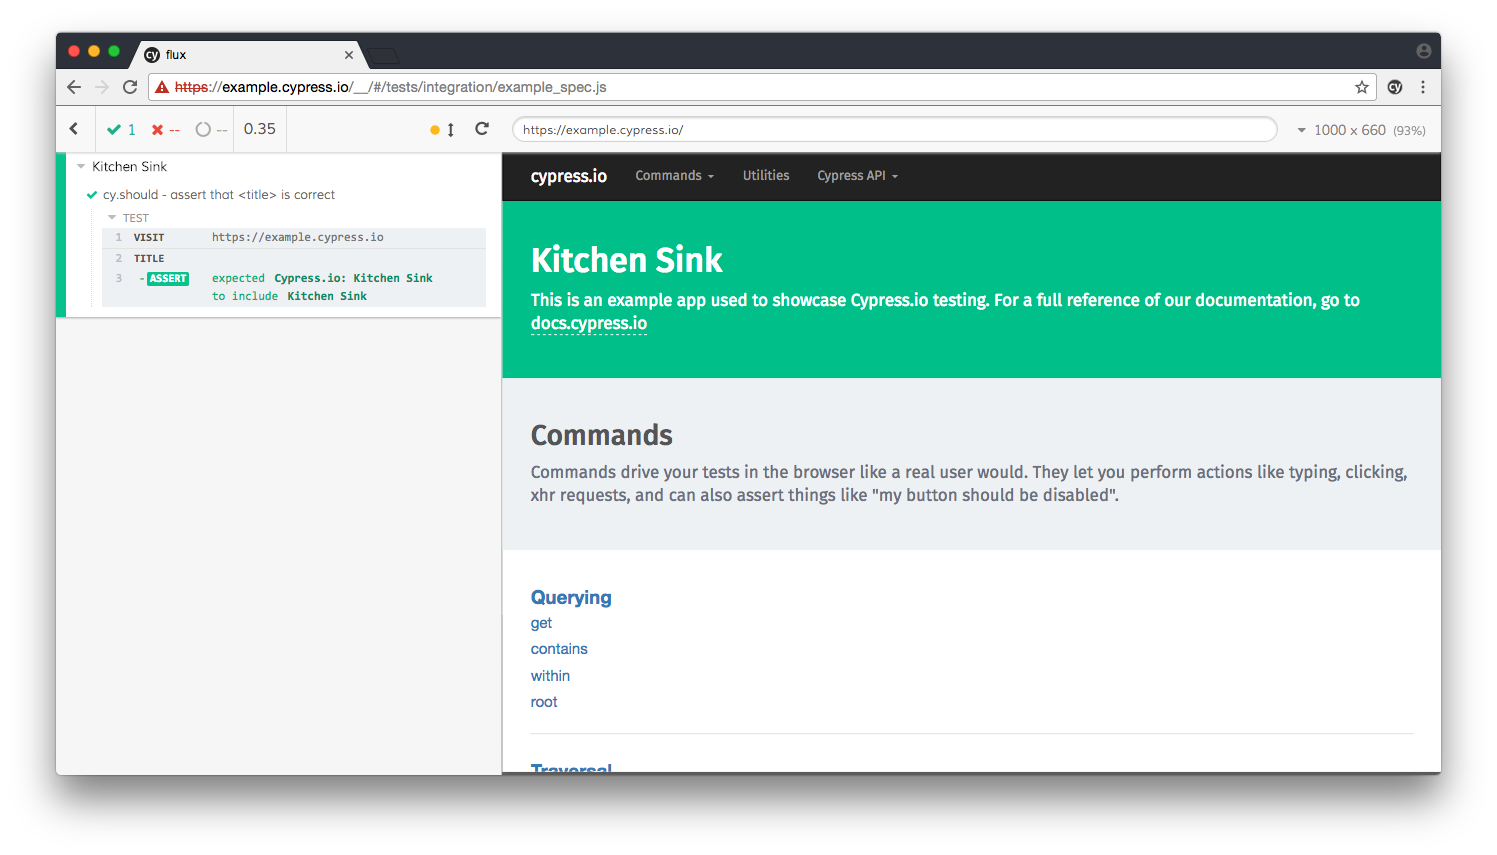
In the example below, we wrote the following code in our test file:
cy.visit('https://example.cypress.io')

cy.title().should('include', 'Kitchen Sink')
In the corresponding Application Preview below, you can see
https://example.cypress.io is being displayed in the righthand side. Not only
is the application visible, but it is fully interactable. You can open your
developer tools to inspect elements as you would in your normal application. The
DOM is completely available for debugging.
The AUT also displays in the size and orientation specified in your tests. You
can change the size or orientation with the
cy.viewport() command or in your
Cypress configuration. If the AUT
does not fit within the current browser window, it is scaled appropriately to
fit within the window.
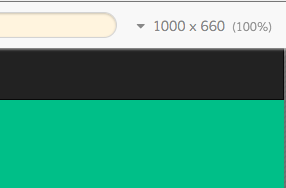
The current size and scale of the AUT is displayed in the top right corner of the window.
The image below shows that our application is displaying at 1000px width,
660px height and scaled to 100%.
Note: The righthand side may also be used to display syntax errors in your test file that prevent the tests from running.
Note: Internally, the AUT renders within an iframe. This can sometimes cause unexpected behaviors explained here.
Selector Playground
The Selector Playground is an interactive feature that helps you:
- Determine a unique selector for an element.
- See what elements match a given selector.
- See what element matches a string of text.
Uniqueness
Cypress will automatically calculate a unique selector to use targeted element by running through a series of selector strategies.
By default Cypress will favor:
data-cydata-testdata-testididclasstagattributesnth-child
This is configurable
Cypress allows you to control how a selector is determined.
Use the Cypress.SelectorPlayground API to control the selectors you want returned.
Best Practices
You may find yourself struggling to write good selectors because:
- Your application uses dynamic ID's and class names
- Your tests break whenever there are CSS or content changes
To help with these common challenges, the Selector Playground automatically
prefers certain data-* attributes when determining a unique selector.
Please read our Best Practices guide on helping you target elements and prevent tests from breaking on CSS or JS changes.
Finding Selectors
To open the Selector Playground, click the button next to the URL at the top of the runner. Hover over elements in your app to preview a unique selector for that element in the tooltip.
Click on the element and its selector will appear at the top. From there, you can copy it to your clipboard ( ) or print it to the console ( ).
Running Experiments
The box at the top that displays the selector is also a text input.
Editing a Selector
When you edit the selector, it will show you how many elements match and highlight those elements in your app.
Switching to Contains
You can also experiment with what cy.contains()
would yield given a string of text. Click on cy.get and switch to
cy.contains.
Type in text to see which element it matches. Note that
cy.contains() only yields the first element that
matches the text, even if multiple elements on the page contain the text.

Disabling Highlights
If you would like to interact with your app while the Selector Playground is open, the element highlighting might get in the way. Toggling the highlighting off will allow you to interact with your app more easily.

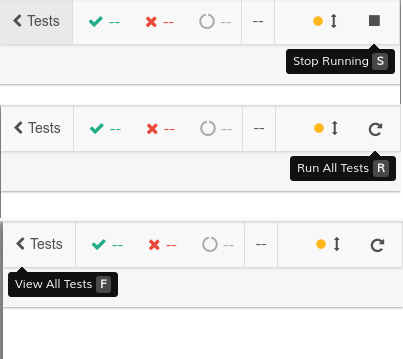
Keyboard Shortcuts
There are keyboard shortcuts to quickly perform common actions from within the Test Runner.
| Key | Action |
|---|---|
r | Rerun tests |
s | Stop tests |
f | Bring focus to 'specs' window |
History
| Version | Changes |
|---|---|
| 3.5.0 | Added keyboard shortcuts to Test Runner |
| 1.3.0 | Added Selector Playground |